Analyze Spectral Integral (ASI)
About
The Analyze Spectral Integral (ASI) Tool calculates a spectral integral ratio (SIR), the area under a log-transformed continuous reflectance signature and the area under a log-inverted convex hull. The user is able to set a range where the calculation will be performed. In contrast to a simple index, spectral integral analysis considers all available bands in the corresponding wavelength range even though the result will be an index of area proportions.
Additionally, the user can decide whether the continuum removed spectra will be written to a separate raster image. Removing the continuum of a spectrum allows for the analysis of clearly defined absorption features between specified reflectance peaks or refer analysis techniques to maximum absorption depth (see bullet point 9 below).
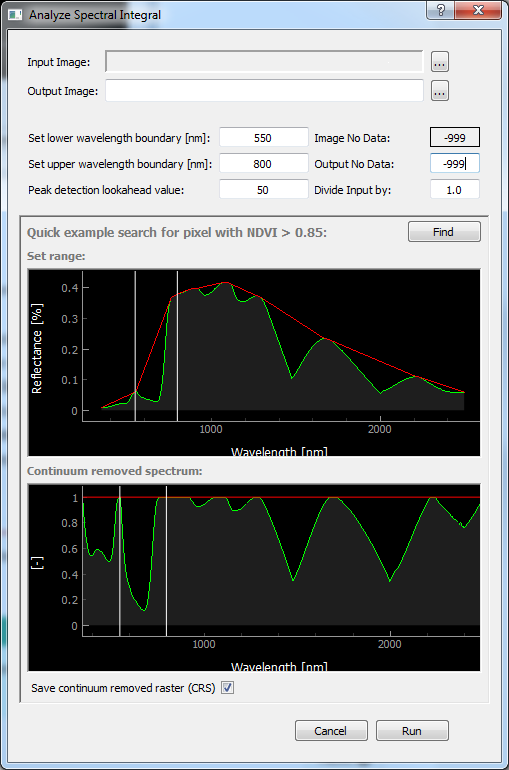
Figure 1: The ASI Tool.
Getting Started
Start
Analyze Spectral Integral (ASI)from
(Figure 1).Import a GDAL readable hyperspectral raster image.
Click Find and Plot to display an example of a live vegetation raster pixel with a NDVI-value > 0.85.
Change the wavelength range of interest (lower and upper wavelength boundary) in the text fields by hitting enter to set the range in which the integral is to be calculated. By default, the chlorophyll absorption between 550 nm and 800 nm is selected.
(Optional): increase/decrease the peak detection lookahead value to exclude/include reflectance peaks as absorption feature separators.
Select the output path and filename.
Assign an output no data value.
(Optional): Activate the check button
Save continuum removed raster (CRS)to save the continuum removed spectra for the selected wavelength range (saved as <filename>_crs.bsq)(Optional): Click the check button
Save 3-band carotenoid, chlorophyll a+b, and liquid water absorption imageto generate a 3-band SIR output image: The viewed range will be automatically set to 460-1100 nm. After calculation of the convex hull, output bands will be separated by carotenoids (Ccx) absorption (460-554 nm), Chlorophyll a+b (Cab) absorption (554-800 nm) and liquid water absorption (900-1100 nm) dynamically. The algorithm will automatically separate the respective absorption feature spaces via green peak detection and intercept analysis between spectrum and hull The respective output band value consists of the ratio between the log-inverted A’ = (log(1 / Reflectance)) absorption area and the log-inverted area under the convex hull:
(A’_reflectance - A’_convex hull) / A’_reflectance
If activated, a <filename>_3band_car_cab_h2o.bsq suffix will be added to the assigned <filename>Click Run to start calculation.
Tip
If you like to write a full range continuum removed raster image set the lower boundary to
400 nm and the upper boundary to 2500 nm which is also the maximum admissible range.
Example
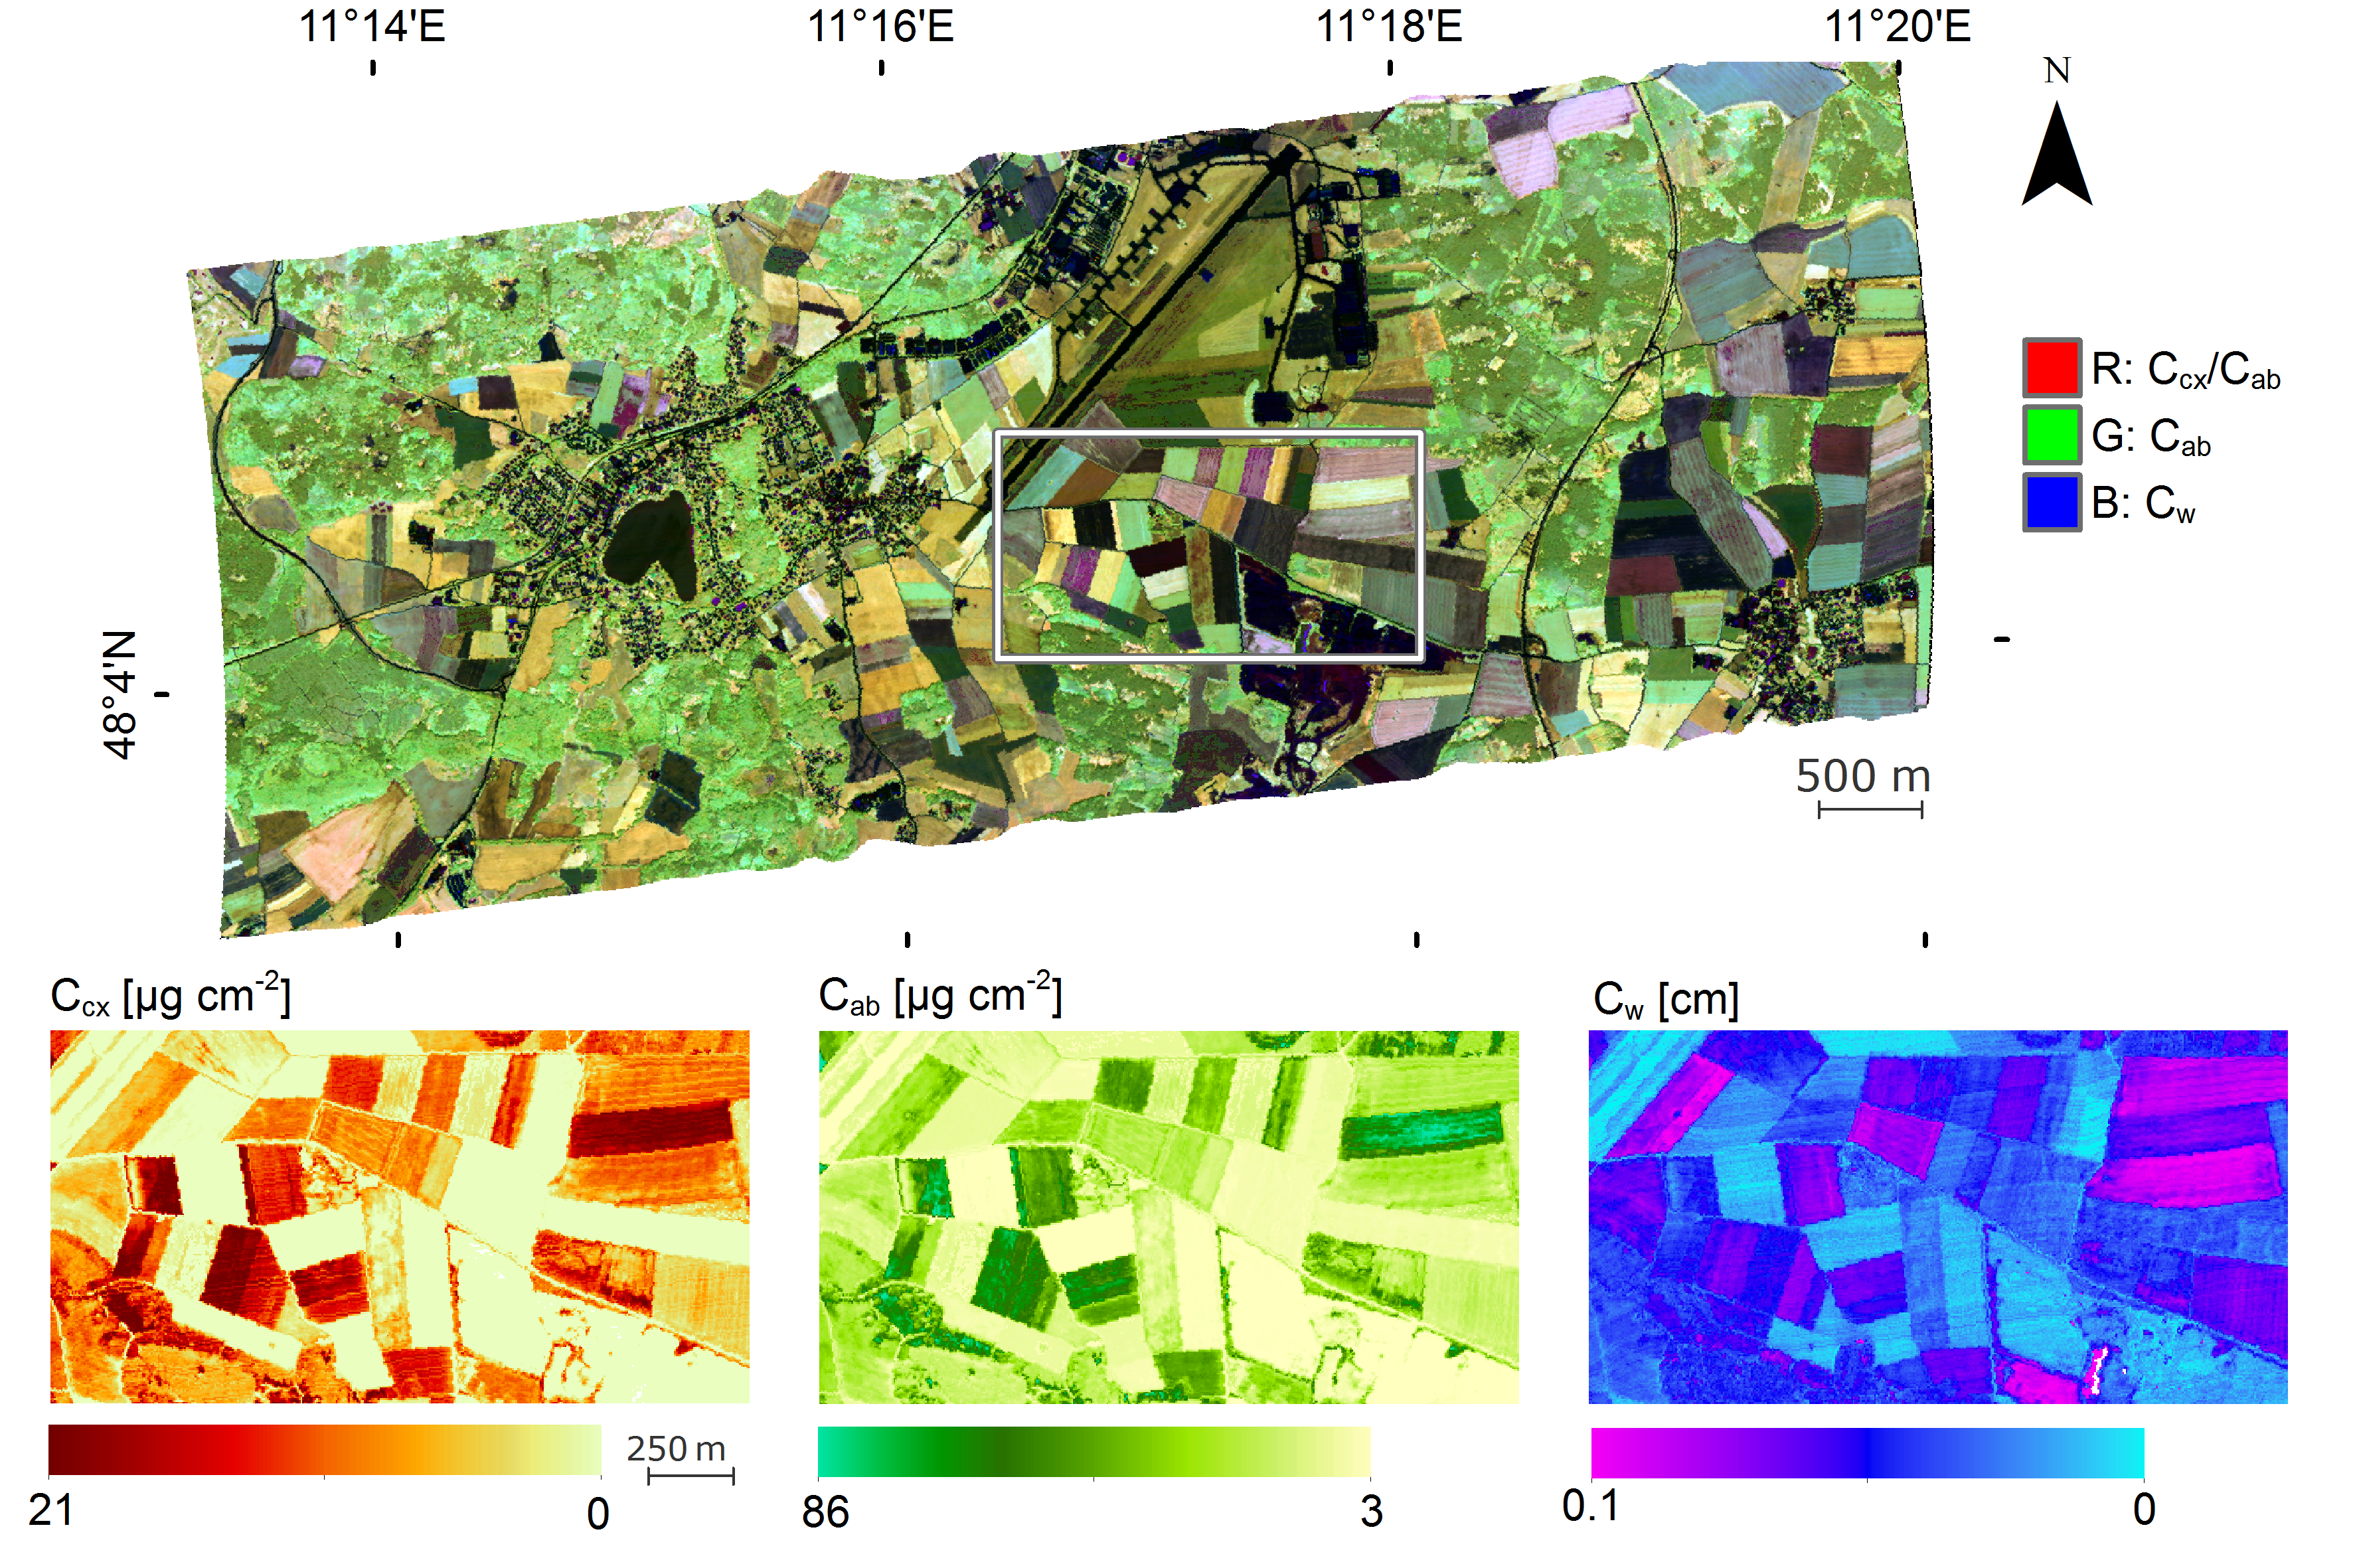
Figure 2: Top: false color 3-band SIR result from spectrometric image data (2nd July 2018, Oberpfaffenhofen, southern Germany, AVIRIS-NG airborne sensor). Bottom: examples of retrieved contents for Carotenoids, Chlorophyll, and water.