Interactive Red Edge Inflection Point (iREIP)
About
The interactive Red-Edge Inflection Point (iREIP) Tool locates the wavelength position of the curvature change in the red edge of a spectrum between 680 and 750 nm. A higher chlorophyll content will cause more absorption in the red part of the spectrum, pushing the red-edge towards longer wavelengths and vice versa. The position of the red-edge inflection point (REIP) therefore allows to draw conclusions about chlorophyll content and plant vitality. Due to the adjustable wavelength range in the tool also other inflection points sensitive to different plant constituents are conceivable.
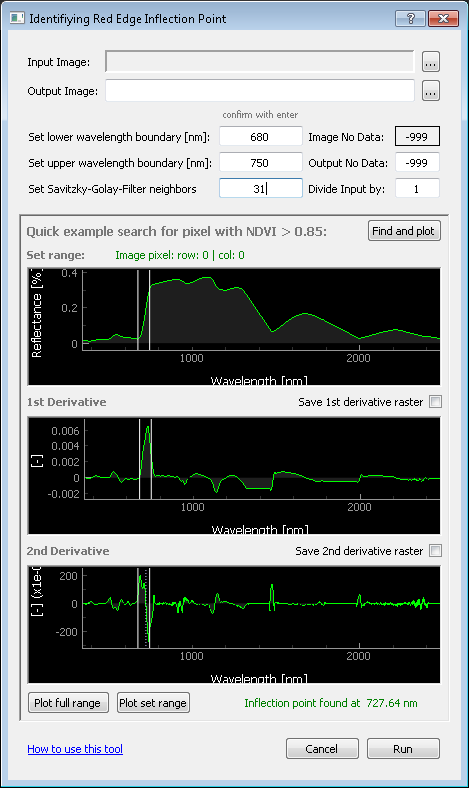
Figure 1: The iREIP Tool.
Getting Started
Start
interactive Red-Edge Inflection Point (iREIP)from
(Figure 1).Import a GDAL readable hyperspectral raster image
Click Find and Plot to display an example of a live vegetation raster pixel with a NDVI > 0.85. If a pixel has been found, both the pixel location and the located inflection point will be displayed in the user interface. In case no unique inflection point has been located, try to smooth the spectrum by increasing the considered
Savitzky-Golay Filterneighbors.Change the wavelength range of interest (lower and upper wavelength boundary) in the text fields by hitting enter to set the range in which the inflection point is to be searched. By default, the red-edge inflection point will be located within 680 - 750 nm. To set a suitable range orient yourself to the zero positions in the second derivative displayed in the lower plot canvas.
Select an output path and filename.
Assign an output no data value.
(Optional): Activate the check buttons
save 1st derivativeand/orsave 2nd derivate rasterto export derivatives of the whole raster image.Click Run to start inflection point localization.